Mumbai slum segmentation
More than one billion people live in slums around the world. In some developing countries, slum residents make up for more than half of the population and lack reliable sanitation services, clean water, electricity, other basic services. We wanted to help.
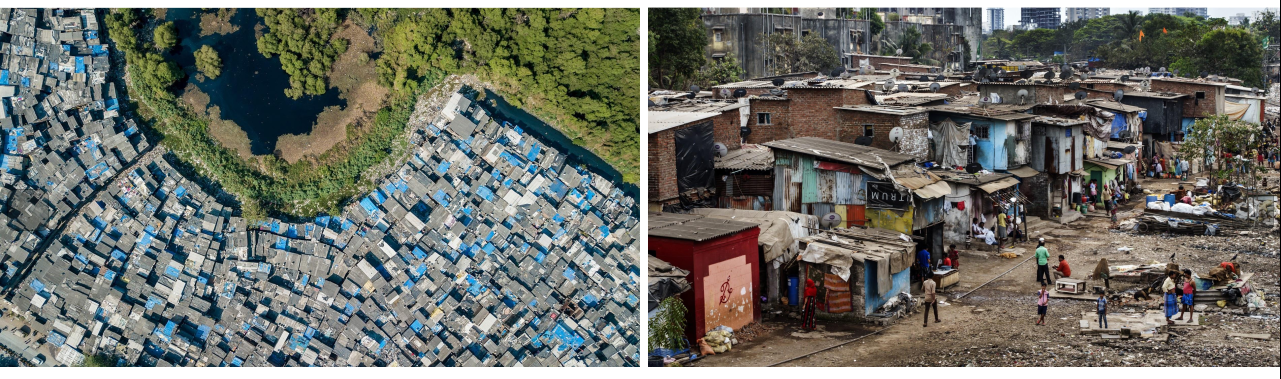
Mumbai Slums
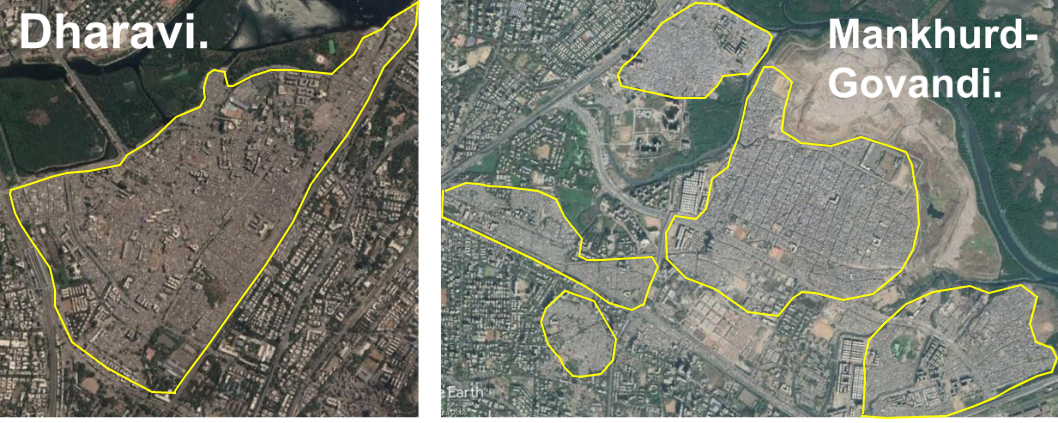
Mumbai is one of the most populous and wealthiest cities in India. However, it is also home to some of the world’s biggest slums – Dharavi, Mankhurd-Govandi belt, Kurla-Ghatkopar belt, Dindoshi and The Bhandup-Mulund slums. The number of slum-dwellers in Mumbai is estimated to be around 9 million, up from 6 million in 2001 that is, 62% of of Mumbai live in informal slums.
When we spoke to the local slum dwellers, we realised that the situation was worse than we expected. Most of them lack access to clean water, basic sanitation and any form of reliable healthcare.
We wanted to help.
What did we do?
Any intitative on slum rehabitiation and improvement relies heavily on slum mapping and monitoring. When we spoke to the relevant authorities, we found out that they mapped slums manually (human annotators), which takes a substantial amount of time. We realised we could automate this and used a deep learning approach to segment and map individual slums from satellite imagery. In addition, we also wrote code to perform change detection and monitor slum change over time. Slum change detection is an important task and analysing increase/decrease of a slum can provide valuable insights.
How did we go about it?
We curated a dataset containing 3-band (RGB) satellite imagery with 65 cm per pixel resolution collected from Google Earth. Each image has a pixel size of 1280x720. The satellite imagery covers most of Mumbai and we include images from 2002 to 2018, to analyze slum change. We used 513 images for training, and 97 images for testing. (Unfortunately, we cannot redistribute the dataset, due to Google policy.)
For slum segmentation and mapping, we trained a Mask R-CNN on our custom dataset. Check our github readme for our training and testing approaches, and our paper for more details.
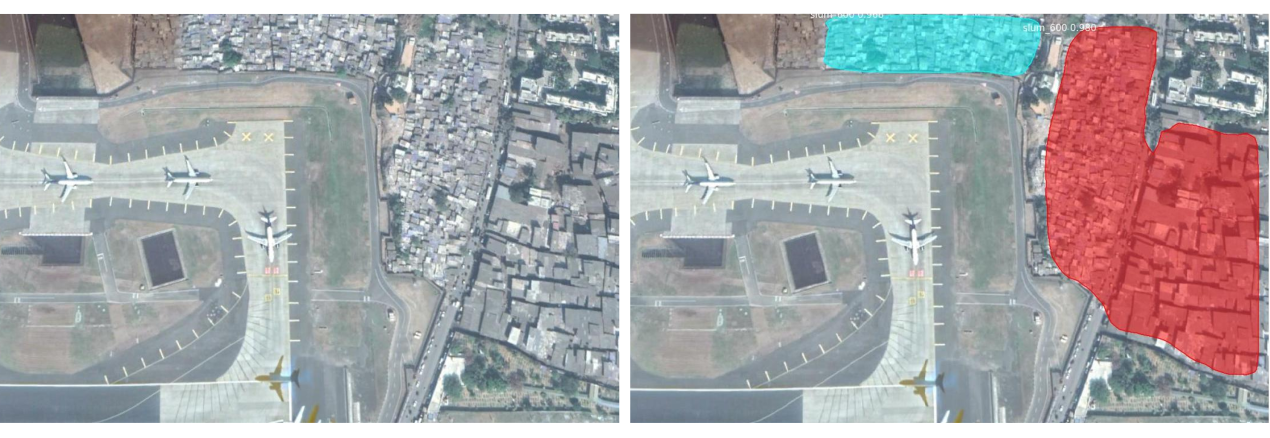
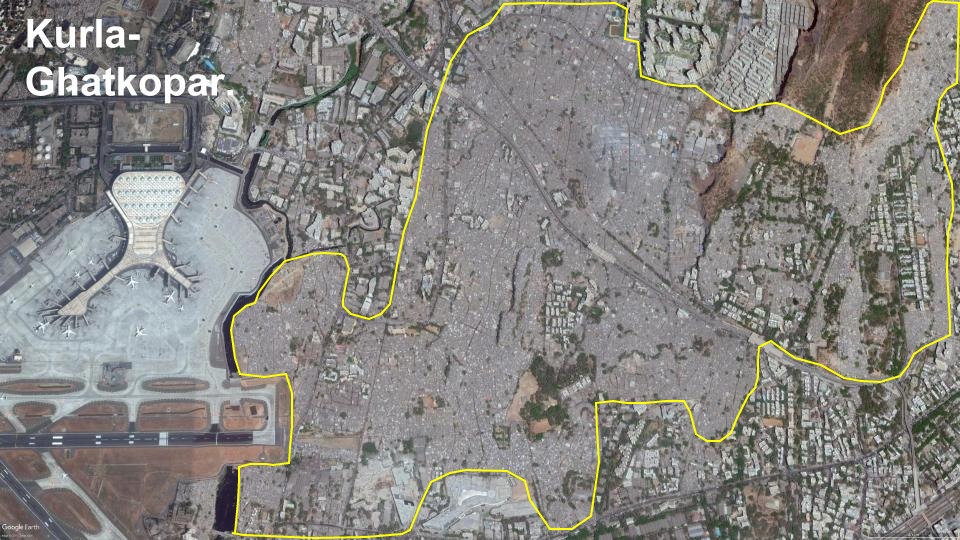
The Kurla-Ghatokopar slums (above) are one of the first things you see when you land in Mumbai, given their proximity to the Chhatrapati Shivaji Maharaj International Airport.
Here’s a short video (above) of our model mapping the Govandi slums.
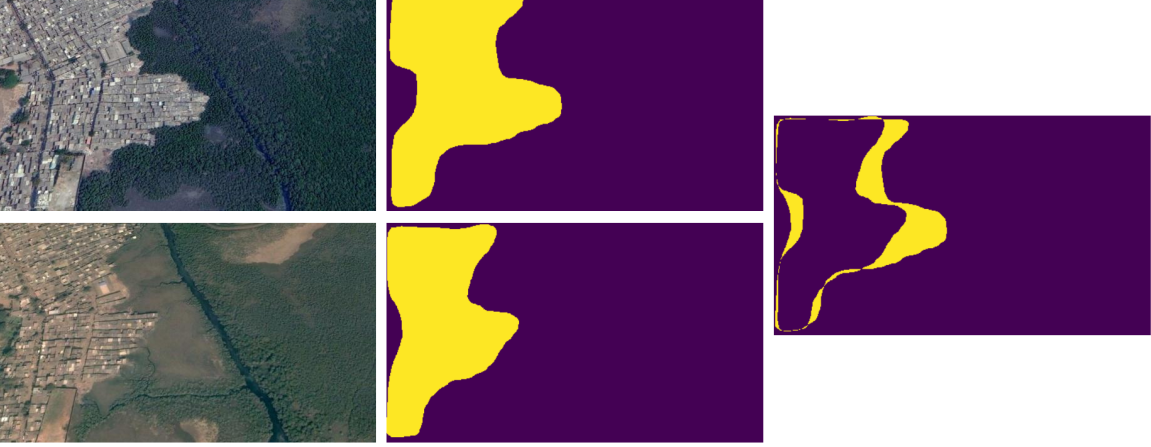
For slum change detection, we took a pair of satellite images, representing the same location at different points of time. We predicted masks for both these images and then subtracted the masks to obtain a percentage icrease/decrease. The following images (below) show a change of +35.25% between 2018 (top row) and 2005 (bottom row) of the same slum.
Contributors
How can you help?
Quite a lot of NGOs work towards slum rehabilitation in Mumbai. You can volunteer (or) donate.
NGOs
Acknowledgements
We would like to thank the Slum Rehabiliation Authority of Mumbai for their data.
Citing
We published our work in the NeurIPS (NIPS) 2018 ML4D workshop. If you’d like to use our research, please cite using -
@article{maiya2018slum,
  title={Slum Segmentation and Change Detection: A Deep Learning Approach},
  author={Maiya, Shishira R and Babu, Sudharshan Chandra},
  journal={arXiv preprint arXiv:1811.07896},
  year={2018}
}